Gantt chart
A Gantt chart is a technique commonly used in project management and is often referred to as a Gantt schedule. Gantt charts are used to manage projects, showing the schedule of tasks, as well as which tasks depend on each other.
What is a Gantt chart?
A Gantt chart is a tool that helps companies keep track of project progress. A Gantt chart is a kind of bar chart, consisting of columns that visualize the various tasks in a project and can be seen as a schematic representation of information.
Why is a Gantt chart useful?
Keeping track of all the tasks within a project can be challenging, and using a Gantt chart makes it easier to stay on top of projects. A Gantt chart makes it possible to keep track of resources, deadlines and tasks.
What types of Gantt charts are there?
There are different types of Gantt charts that can be used, based on the project being undertaken. You can use Gantt charts as project management tools, project planning tools and time tracking tools.
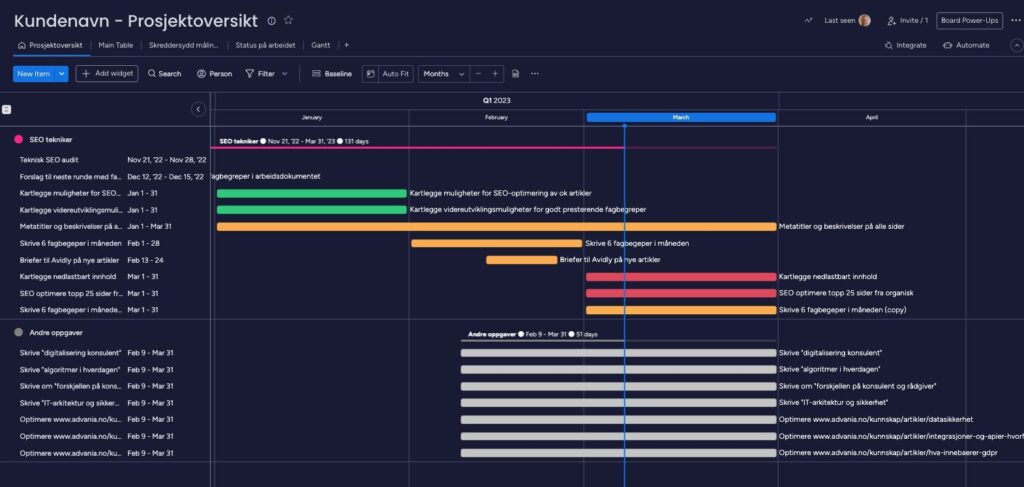
Below we have included what a typical Gantt chart might look like:
In summary
A Gantt chart can be useful for project management and time management, to keep track of different tasks within a project. A Gantt chart makes it possible to keep track of resources, deadlines and tasks to be completed.
Frequently asked questions:
What is a Gantt chart?
A Gantt chart is a technique and a tool that ensures progress in projects.
How to create a Gantt chart?
There are various software programs that make it easy to set up Gantt charts, and Gantt charts can also be set up in Excel.